tadamichi
By Hamish Preston
Many investors use the start of the year to make predictions for the upcoming year and to think about ways to express views on these themes.
This undertaking is not guaranteed to add value: predicting the future is incredibly difficult, and success requires correctly predicting both the drivers of future performance and the upcoming impact of different market segments. The countless possible scenarios mean that it is easy to be wrong-footed.
Nonetheless, the inherent challenge of forecasting means that investors may wish to focus their attention on market segments where there is greater reward for correct insight.
Dispersion provides an initial assessment of the potential reward for such insight. The greater the dispersion, the greater the potential rewards for correctly picking the best-performing constituents in that market.
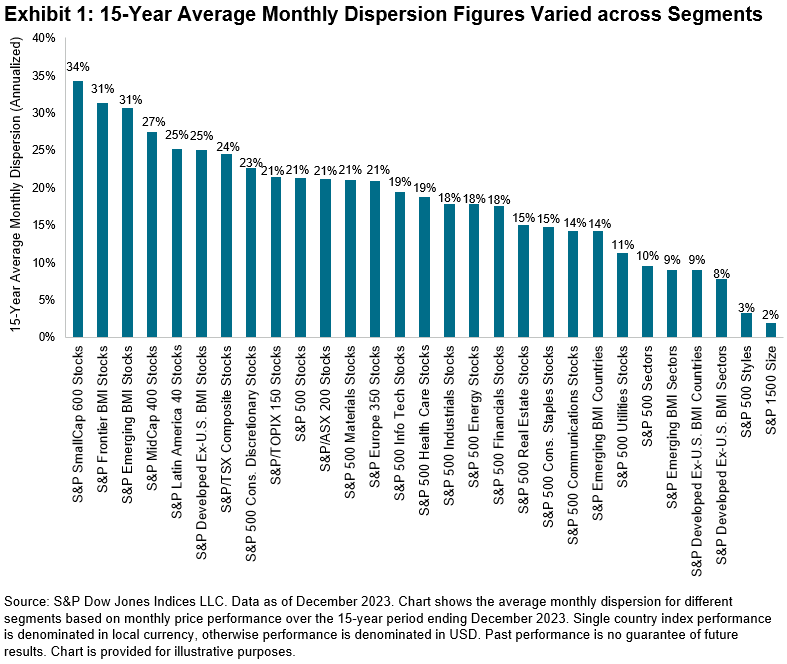
Exhibit 1 shows average monthly dispersion figures for various segments over the 15-year period ending December 2023.
The dispersion figures are calculated for different levels of granularity, including stocks, sectors, countries, U.S. styles and U.S. size segments.
S&P SmallCap 600® stock dispersion was the highest, on average, more than three times higher than the average dispersion among S&P 500® sectors.
Lower levels of dispersion were observed between U.S. size or style segments, or between countries or sectors in the S&P Developed Ex.-U.S. BMI.
So does this mean that investors would be well-served to focus their attention on research into small-cap U.S. equities instead of other areas?
Not necessarily: The relative value of insight also depends on the potential size of the positions that investors may be able to take in different segments.

An investor’s ability to take active positions is related to the average market capitalization of constituents.
For example, there is more capacity to take an active position in a trillion-dollar constituent compared to a smaller constituent.
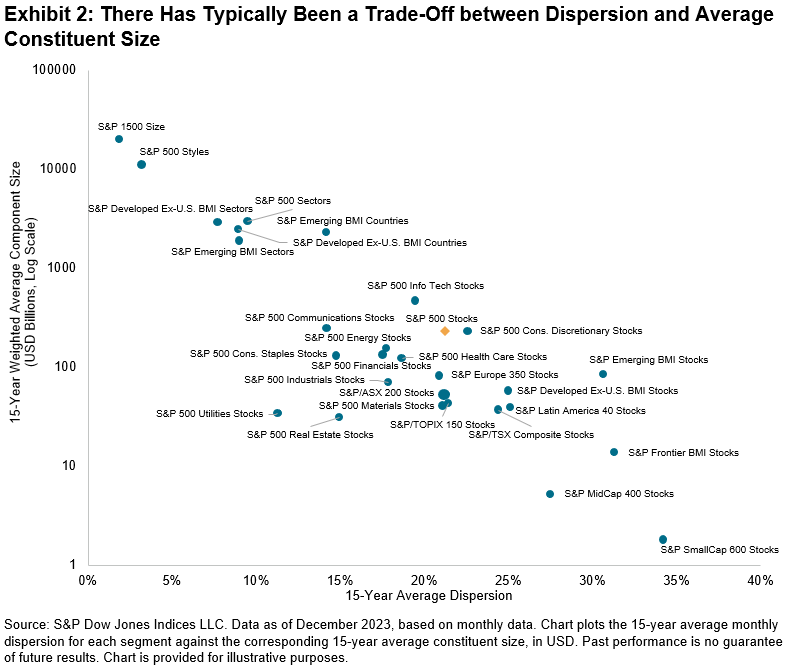
Exhibit 2 plots the average dispersion figures from Exhibit 1 against the index-weighted average constituent size of the different segments over the same 15-year period (note the log scale on the y axis).
Clearly, there has been a trade-off between dispersion and the average constituent size.
Higher dispersion segments, which offer greater expected reward for correct insight, may require smaller positions compared to lower dispersion segments with larger constituents.

Capacity-Adjusted Dispersion provides a way to account for capacity when considering the potential value of insight.
It is calculated by multiplying the potential reward to correct selections (dispersion) and potential size of active positions (average constituent size).
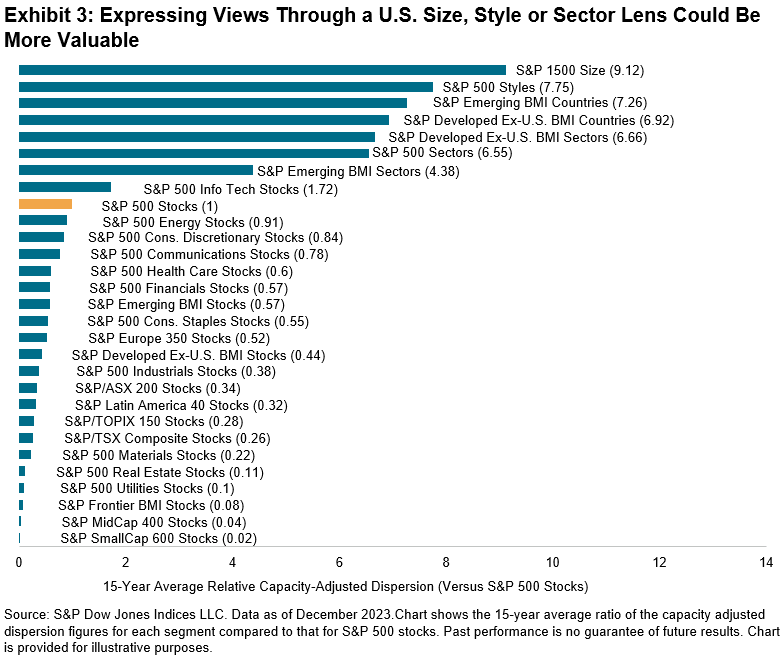
Exhibit 3 shows the average ratio of capacity-adjusted dispersion measures for different segments compared to that of S&P 500 stocks, based on monthly data over the 15-year period ending December 2023.
Assuming that an investor’s predictions are similarly valuable across each segment, Exhibit 3 suggests that selecting among the S&P Composite 1500® size segments – the S&P 500, S&P MidCap 400®, and S&P SmallCap 600 – may offer more than nine times the potential opportunity compared to picking S&P 500 stocks.
Similarly, choosing between the S&P 500 Growth and S&P 500 Value or selecting among S&P 500 sectors could have provided similar opportunities as picking country components of the S&P Emerging BMI or S&P Developed Ex-U.S. BMI.
Such is the difference in average constituent size that insights into S&P SmallCap 600 stocks would have to be 50 times more valuable than insights into S&P 500 stocks to provide the same capacity-adjusted opportunity.

As a result, expressing views through a U.S. size, style and sector lens could present similar opportunities as using a country lens. The relative capacity of these segments means they may offer greater opportunities than many other segments.
Disclosure: Copyright © 2023 S&P Dow Jones Indices LLC, a division of S&P Global. All rights reserved. This material is reproduced with the prior written consent of S&P DJI. For more information on S&P DJI please visit S&P Dow Jones Indices. For full terms of use and disclosures please visit www.spdji.com/terms-of-use.
Original Post
Editor’s Note: The summary bullets for this article were chosen by Seeking Alpha editors.


